Downtime Reporting
Downtime in incite offers a set of 7 pre-configured Graphical and Summary/Text based reports
Event Detail
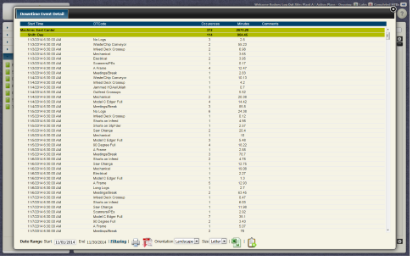
Downtime Reports - Downtime Event Report |
- The Event Detail Report displays downtime events in a simple tabular format
- This report can be grouped by any Downtime Field (in the example above both Machine and Shift)
Shift Summary
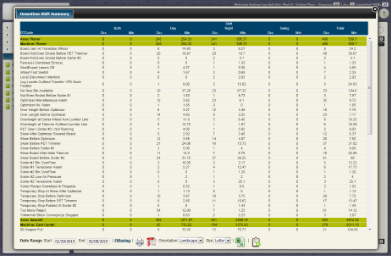
(Downtime Reports - Downtime Shift Summary Report |
- The Shift Summary Report displays downtime occurances and minutes broken down by Shift
- This report can be grouped by several fields, using a 'top field' (Visible Fields) and and multiple groupings (Grouping Fields)
Daily Summary
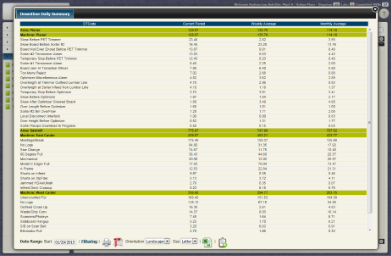
Downtime Reports - Downtime Daily Summary Report |
- The Daily Summary Report shows a summary of downtime minutes for a selected day
Pareto Analysis
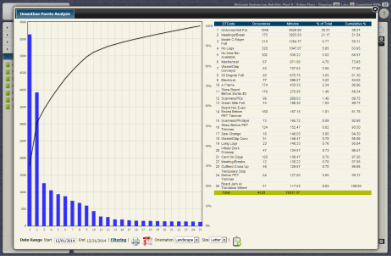
Downtime Reports - Downtime Pareto Analysis Report |
- The Pareto Analysis Report displays as bars the number of minutes assigned to each Downtime Code field, organized with the largest bar on the left followed by the next
- A line graph is also plotted, which represents the cumulative percentage of minutes at that point (right y-axis)
- As the graph moves to the right the cumulative percentage will eventually become 100%
Downtime Graph
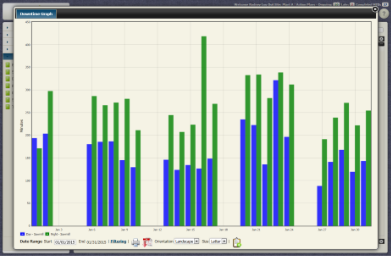
Downtime Reports - Downtime Graph Report |
- The Downtime Graph shows the number of minutes in a graphical format
- The report can be grouped by several fields (Day, Week, Month, Shift, Area, Machine, DT Code etc.)
Start-Up Effectiveness
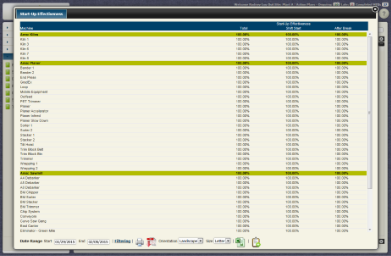
Downtime Reports - Downtime Start-up Effectiveness Report |
- The Start-Up Effectiveness Report shows the effectiveness of start-up events, downtime events that are created where operations return to normal
Top Ten Downtime
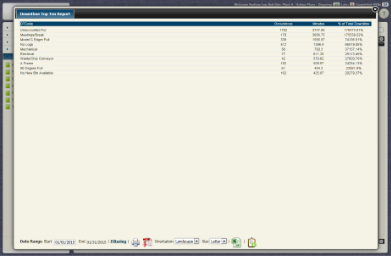
Downtime Reports - Top Ten Downtime Report |
- The Top Ten Downtime Report shows the top ten downtime events over a given range based on length (measured in minutes) and number of occurences